Prowler 2.0: New release with improvements and new checks ready for re:Invent and BlackHat EU

Taking advantage of this week AWS re:Invent and  next week BlackHat Europe, I wanted to push forward a new version of Prowler.

In case you are new to Prowler:

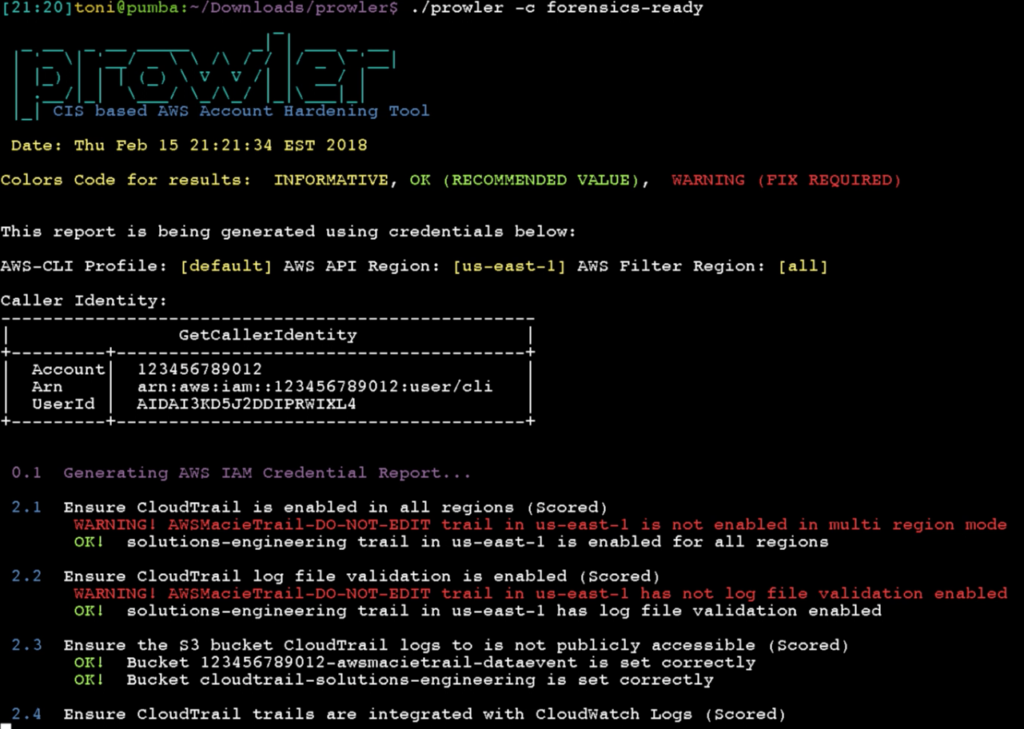
Prowler is an AWS Security Best Practices Assessment, Auditing, Hardening and Forensics Readiness Tool. It follows guidelines of the CIS Amazon Web Services Foundations Benchmark and DOZENS of additional checks including GDPR and HIPAA groups. Official CIS benchmark for AWS guide is here.

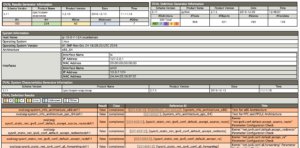
This new version has more than 20 new extra checks (of +90), including GDPR and HIPAA group of checks as for a reference to help organizations to check the status of their infrastructure regarding those regulations. Prowler has also been refactored to allow easier extensibility. Another important feature is the JSON output that allows Prowler to be integrated, for example, with Splunk or Wazuh (more about that soon!). For all details about what is new, fixes and improvements please see the release notes here: https://github.com/toniblyx/prowler/releases/tag/2.0

For me, personally, there are two main benefits of Prowler. First of all, it helps many organizations and individuals around the world to improve their security posture on AWS, and using just one easy and simple command, they realize what do they have to do and how to get started with their hardening. Second, I’m learning a lot about AWS, its API, features, limitations, differences between services and AWS security in general.

Said that, I’m so happy to present Prowler 2.0 in BlackHat Europe next week in London! It will be at the Arsenal

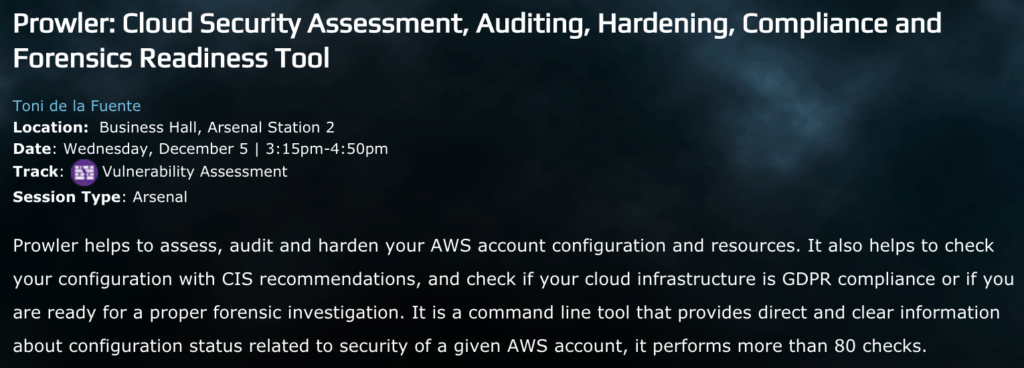
and I’ll talk about AWS security, and show all new features, how it works, how to take advantage of all checks and output methods and some other cool things. If you are around please come by and say hello, I’ve got a bunch of laptop sticklers! Here all details, Location:  Business Hall, Arsenal Station 2. Date: Wednesday, December 5 | 3:15pm-4:50pm. Track Vulnerability Assessment. Session Type: Arsenal

BIG THANKS!

I want to thank the Open Source community that has helped out since first day, almost a thousand stars in Github and more than 500 commits talk by itself. Prowler has become pretty popular out there and all the community support is awesome, it motivates me to keep up with improvements and features. Thanks to you all!!

Prowler future?

Main goals for future versions are: to improve speed and reporting, including switch base code to Python to support existing checks and new ones in any language.

If you are interested on helping out, don’t hesitate to reach out to me. \m/

Prowler 1.6: AWS Security Best Practices Assessment and Forensics Readiness Tool

It looks like Prowler has become a popular tool for those concerned about AWS security. I just made Prowler to solve an internal requirement we have here in Alfresco. I decided to make it public and I started getting a lot of feedback, pull requests, comments, advices, bugs reported, new ideas and I keep pushing to make it better and more comprehensive following all what cloud security community seems to need.
I know Prowler is not the best tool out there but it does what I wanted it to do: “Take a picture of my AWS account (or accounts) security settings and tell me from where to start working to improve it”. Do the basics, at least. And that’s what it does. I would use other tools to track service change, etc., I discuss that also in my talks.
Currently, Prowler performs 74 checks (for an entire list run `prowler -l`), being 52 of them part of the CIS benchmark.

Digital Forensics readiness capabilities into Prowler 1.6

`prowler -c forensics-ready`
I’m into DFIR, I love it and I read lot about cloud digital forensics and incident response, I enjoy investing my time R&D about that subject. And I’m concerned about random or targeted attacks to cloud infrastructure. For the talk I’m doing today at the SANS Cloud Security Summit 2018 in San Diego, I wanted to show something new and I thought about adding new checks to Prowler related to forensics and how to make sure you have all (or as much) what you need to perform a proper investigation in case of incident, logs that are not enabled by default in any AWS account by the way. Some of those checks are included and well described in the current CIS benchmark for AWS, or even in the CIS benchmark for AWS three tiers web deployments (another hardening guide that is way less popular but pretty interesting too), but there are checks that are not included anywhere. For example, I believe it is good idea to keep record of your API Gateway logs in your production accounts or even your ELB logs, among many others. So when you run  `prowler -c forensics-ready` now you will get the status of your resources across all regions, and you can make sure you are logging all what you may eventually need in case of security incident. Currently these are the checks supported (https://github.com/toniblyx/prowler#forensics-ready-checks):
  • 2.1 Ensure CloudTrail is enabled in all regions (Scored)
  • 2.2 Ensure CloudTrail log file validation is enabled (Scored)
  • 2.3 Ensure the S3 bucket CloudTrail logs to is not publicly accessible (Scored)
  • 2.4 Ensure CloudTrail trails are integrated with CloudWatch Logs (Scored)
  • 2.5 Ensure AWS Config is enabled in all regions (Scored)
  • 2.6 Ensure S3 bucket access logging is enabled on the CloudTrail S3 bucket (Scored)
  • 2.7 Ensure CloudTrail logs are encrypted at rest using KMS CMKs (Scored)
  • 4.3 Ensure VPC Flow Logging is Enabled in all VPCs (Scored)
  • 7.12 Check if Amazon Macie is enabled (Not Scored) (Not part of CIS benchmark)
  • 7.13 Check if GuardDuty is enabled (Not Scored) (Not part of CIS benchmark)
  • 7.14 Check if CloudFront distributions have logging enabled (Not Scored) (Not part of CIS benchmark)
  • 7.15 Check if Elasticsearch Service domains have logging enabled (Not Scored) (Not part of CIS benchmark)
  • 7.17 Check if Elastic Load Balancers have logging enabled (Not Scored) (Not part of CIS benchmark)
  • 7.18 Check if S3 buckets have server access logging enabled (Not Scored) (Not part of CIS benchmark)
  • 7.19 Check if Route53 hosted zones are logging queries to CloudWatch Logs (Not Scored) (Not part of CIS benchmark)
  • 7.20 Check if Lambda functions are being recorded by CloudTrail (Not Scored) (Not part of CIS benchmark)
  • 7.21 Check if Redshift cluster has audit logging enabled (Not Scored) (Not part of CIS benchmark)
  • 7.22 Check if API Gateway has logging enabled (Not Scored) (Not part of CIS benchmark)
Screenshot while running `forensics-ready` group of checks, here only showing 3 of the first checks that are part of that group
I haven’t added yet a RDS logging check and I’m probably missing many others so please feel free to open an issue in Github and let me know!
If you want to check out my slide deck used during my talk at the SANS Cloud Security Summit 2018 in San Diego, look at here: https://github.com/toniblyx/SANSCloudSecuritySummit2018

Automate or Die! My next talk at RootedCON 2017 in Madrid

UPDATED!  My talk will be on March, Friday the 3rd at 11AM (Sala 25)
Regardless I’ve given many talks in Spain during the last 18 years, It has been a while since I don’t do a talk in a security congress. I think last time was NcN when I presented phpRADmin in 2006.
I have to confess that I was mad to talk at RootedCON. Living abroad for more than four years now, the RootedCON has been a reference event for Spanish speakers and I always have been following it very closely, I think it is one of the most popular security conferences in Spain.
Last year I tried to attend with a “Docker Security” paper but it wasn’t good enough, and honestly I didn’t work much on the paper itself. This time I worked on a more decent paper (and better tittle as well) and voila! My talk was approved.
And what I’m gonna talk about? Security in IaaS, attacks, hardening, incident response, forensics and all about its automation. Despite I will talk about general concept related to AWS, Azure and GCP, I will show specific demos and threats in AWS and I will go in detail with some caveats and hazards in AWS. My talk is called “Automate or die! How to survive to an attack in the Cloud” and you have more details here.
If you are in Spain or around the place, don’t miss the opportunity to learn from people like Mikko Hypponen, Paul Vixie, Hugo Teso, Juan Garrido or Chema Alonso. As you may see in the full list, there are 3 days plenty of good material to improve your skills from very good professionals, they also offer a training day. And compared to the price of security cons in other countries, this one is not expensive at all.
My talk will be on March, Friday the 3rd at 11AM (Sala 25). Looking forward to see you there!

Hardening assessment and automation with OpenSCAP in 5 minutes

SCAP (Security Content Automation Protocol) provides a mechanism to check configurations, vulnerability management and evaluate policy compliance for a variety of systems. One of the most popular implementations of SCAP is OpenSCAP and it is very helpful for vulnerability assessment and also as hardening helper.
In this article I’m going to show you how to use OpenSCAP in 5 minutes (or less). We will create reports and also dynamically hardening a CentOS 7 server.
Installation for CentOS 7:
yum -y install openscap openscap-utils scap-security-guide
wget http://people.redhat.com/swells/scap-security-guide/RHEL/7/output/ssg-rhel7-ocil.xml -O /usr/share/xml/scap/ssg/content/ssg-rhel7-ocil.xml
Create a configuration assessment report in xccdf (eXtensible Configuration Checklist Description Format):
oscap xccdf eval --profile stig-rhel7-server-upstream \
--results $(hostname)-scap-results-$(date +%Y%m%d).xml \
--report $(hostname)-scap-report-$(date +%Y%m%d)-after.html \
--oval-results --fetch-remote-resources \
--cpe /usr/share/xml/scap/ssg/content/ssg-rhel7-cpe-dictionary.xml \
 /usr/share/xml/scap/ssg/content/ssg-centos7-xccdf.xml
Now you can see your report, and it will be something like this (hostname.localdomain-scap-report-20161214.html):
 
See also different group rules considered:
You can go through the fails in red and see how to fix them manually or dynamically generate a bash script to fix them. Take a note of the Score number that your system got, it will be a reference after hardening.
In order to generate a script to fix all needed and harden the system (and improve the score), we need to know our report result-id, we can get it running this command using the results xml file:
export RESULTID=$(grep TestResult $(hostname)-scap-results-$(date +%Y%m%d).xml | awk -F\" '{ print $2 }')
Run oscap command to generate the fix script, we will call it fixer.sh:
oscap xccdf generate fix \
--result-id $RESULTID \
--output fixer.sh $(hostname)-scap-results-$(date +%Y%m%d).xml
chmod +x fixer.sh
Now you should have a fixer.sh script to fix all issues, open and edit it if needed. For instance, remember that the script will enable SELINUX and do lots of changes to Auditd configuration. If you have a different configuration you can run commands like bellow after running ./fixer.sh to keep SElinux permissive and in case you can change some actions of Auditd.
sed -i "s/^SELINUX=.*/SELINUX=permissive/g" /etc/selinux/config
sed -i "s/^space_left_action =.*/space_left_action = syslog/g" /etc/audit/auditd.conf
sed -i "s/^admin_space_left_action =.*/admin_space_left_action = syslog/g" /etc/audit/auditd.conf
Then you can build a new assessment report to see how much it improved your system hardening (note I added -after to the files name):
oscap xccdf eval --profile stig-rhel7-server-upstream \
--results $(hostname)-scap-results-$(date +%Y%m%d)-after.xml \
--report $(hostname)-scap-report-$(date +%Y%m%d)-after.html \
--oval-results --fetch-remote-resources \
--cpe /usr/share/xml/scap/ssg/content/ssg-rhel7-cpe-dictionary.xml \
 /usr/share/xml/scap/ssg/content/ssg-centos7-xccdf.xml
Additionally, we can generate another evaluation report of the system in OVAL format (Open Vulnerability and Assessment Language):
oscap oval eval --results $(hostname)-oval-results-$(date +%Y%m%d).xml \
--report $(hostname)-oval-report-$(date +%Y%m%d).html \
/usr/share/xml/scap/ssg/content/ssg-rhel7-oval.xml
OVAL report will give you another view of your system status and configuration ir order to allow you improve it and follow up, making sure your environment reaches the level your organization requires.
Sample OVAL report:
Happy hardening!